cause–effect diagram
cause–effect diagram(fish-bone diagram; Ishikawa diagram) A diagram that, by working back from a given problem, is used to identify the main categories of possible causes of the problem and then to generate detailed lists of specific possible causes. Attributed to Kaoru Ishikawa, the technique is one of a set taught to members of quality circles or quality-improvement teams within the total quality management process. The method involves four steps: (1) identifying the problem or effect to be analysed; (2) identifying the main classes of possible causes using categories appropriate to the process under review; (3) identifying possible detailed causes under each of these categories; (4) recording these possible causes on the diagram to enable them to be discussed and clarified.
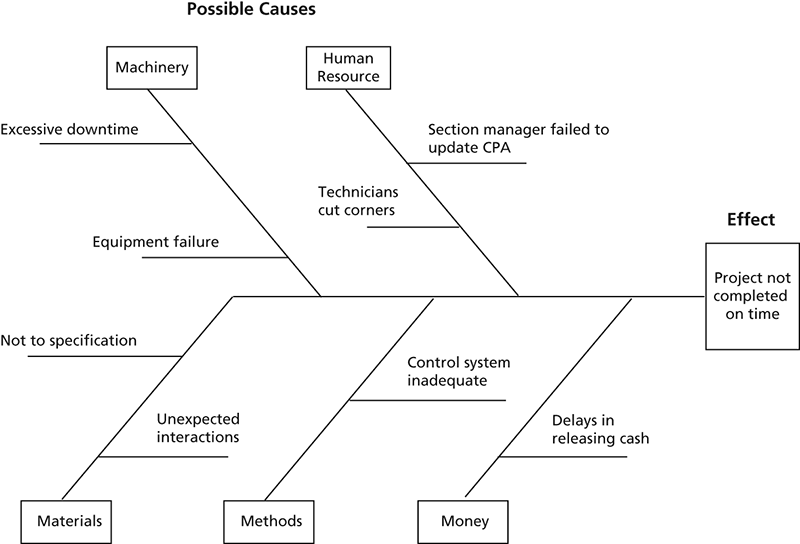
Cause–effect diagram.
- consolidated profit and loss account
- consolidation
- consortium
- consortium relief
- constant-dollar plan
- constant sum scales
- constraint
- constructive dismissal
- constructive total loss
- consular invoice
- Consultative Committee of Accountancy Bodies
- consumable materials
- consumer
- consumer advertising
- consumer buying behaviour
- consumer credit
- Consumer Credit Act 1974
- Consumer Credit Protection Act 1968
- consumer-credit register
- consumer goods
- consumer groups
- consumer instalment loan
- consumerism
- consumer market
- consumer-oriented marketing